#10 完成耕地质量评估页面,大气输入通量页面,修改灌溉水输入通量

Open
Ding wants to merge 3 commits from qw/ding into qw/master

+ 1 - 1
.env

@@ -1,3 +1,3 @@
-VITE_API_URL= 'https://127.0.0.1:5000'
+VITE_API_URL= 'http://localhost:5000'
 VITE_TMAP_KEY='2R4BZ-FF4RM-Q6C6U-6TCJL-O2EN5-DVFH5'
 'https://www.soilgd.com:5000''https://127.0.0.1:5000'

+ 6 - 1
components.d.ts

@@ -29,9 +29,12 @@ declare module 'vue' {
     ElCard: typeof import('element-plus/es')['ElCard']
     ElCol: typeof import('element-plus/es')['ElCol']
     ElContainer: typeof import('element-plus/es')['ElContainer']
+    ElDialog: typeof import('element-plus/es')['ElDialog']
     ElDropdown: typeof import('element-plus/es')['ElDropdown']
     ElDropdownItem: typeof import('element-plus/es')['ElDropdownItem']
     ElDropdownMenu: typeof import('element-plus/es')['ElDropdownMenu']
+    ElForm: typeof import('element-plus/es')['ElForm']
+    ElFormItem: typeof import('element-plus/es')['ElFormItem']
     ElHeader: typeof import('element-plus/es')['ElHeader']
     ElIcon: typeof import('element-plus/es')['ElIcon']
     ElImage: typeof import('element-plus/es')['ElImage']
@@ -39,15 +42,18 @@ declare module 'vue' {
     ElMain: typeof import('element-plus/es')['ElMain']
     ElMenu: typeof import('element-plus/es')['ElMenu']
     ElMenuItem: typeof import('element-plus/es')['ElMenuItem']
+    ElOption: typeof import('element-plus/es')['ElOption']
     ElRadio: typeof import('element-plus/es')['ElRadio']
     ElRadioGroup: typeof import('element-plus/es')['ElRadioGroup']
     ElRow: typeof import('element-plus/es')['ElRow']
     ElScrollbar: typeof import('element-plus/es')['ElScrollbar']
+    ElSelect: typeof import('element-plus/es')['ElSelect']
     ElSubMenu: typeof import('element-plus/es')['ElSubMenu']
     ElTable: typeof import('element-plus/es')['ElTable']
     ElTableColumn: typeof import('element-plus/es')['ElTableColumn']
     ElTabPane: typeof import('element-plus/es')['ElTabPane']
     ElTabs: typeof import('element-plus/es')['ElTabs']
+    ElTag: typeof import('element-plus/es')['ElTag']
     HeavyMetalEnterprisechart: typeof import('./src/components/atmpollution/heavyMetalEnterprisechart.vue')['default']
     HelloWorld: typeof import('./src/components/HelloWorld.vue')['default']
     IconCommunity: typeof import('./src/components/icons/IconCommunity.vue')['default']
@@ -61,7 +67,6 @@ declare module 'vue' {
     RouterLink: typeof import('vue-router')['RouterLink']
     RouterView: typeof import('vue-router')['RouterView']
     TencentMapView: typeof import('./src/components/irrpollution/tencentMapView.vue')['default']
-    Test: typeof import('./src/components/irrpollution/test.vue')['default']
     TheWelcome: typeof import('./src/components/TheWelcome.vue')['default']
     Waterassaydata1: typeof import('./src/components/irrpollution/waterassaydata1.vue')['default']
     Waterassaydata2: typeof import('./src/components/irrpollution/waterassaydata2.vue')['default']

+ 4 - 4
package-lock.json

@@ -5052,7 +5052,7 @@
       "version": "1.9.16",
       "resolved": "https://registry.npmjs.org/@types/leaflet/-/leaflet-1.9.16.tgz",
       "integrity": "sha512-wzZoyySUxkgMZ0ihJ7IaUIblG8Rdc8AbbZKLneyn+QjYsj5q1QU7TEKYqwTr10BGSzY5LI7tJk9Ifo+mEjdFRw==",
-      "dev": true,
+      "devOptional": true,
       "license": "MIT",
       "dependencies": {
         "@types/geojson": "*"
@@ -5293,7 +5293,7 @@
     },
     "node_modules/@vue-leaflet/vue-leaflet": {
       "version": "0.10.1",
-      "resolved": "https://registry.npmmirror.com/@vue-leaflet/vue-leaflet/-/vue-leaflet-0.10.1.tgz",
+      "resolved": "https://registry.npmjs.org/@vue-leaflet/vue-leaflet/-/vue-leaflet-0.10.1.tgz",
       "integrity": "sha512-RNEDk8TbnwrJl8ujdbKgZRFygLCxd0aBcWLQ05q/pGv4+d0jamE3KXQgQBqGAteE1mbQsk3xoNcqqUgaIGfWVg==",
       "license": "MIT",
       "dependencies": {
@@ -8123,7 +8123,7 @@
     },
     "node_modules/leaflet": {
       "version": "1.9.4",
-      "resolved": "https://registry.npmmirror.com/leaflet/-/leaflet-1.9.4.tgz",
+      "resolved": "https://registry.npmjs.org/leaflet/-/leaflet-1.9.4.tgz",
       "integrity": "sha512-nxS1ynzJOmOlHp+iL3FyWqK89GtNL8U8rvlMOsQdTTssxZwCXh8N2NB3GDQOL+YR3XnWyZAxwQixURb+FA74PA==",
       "license": "BSD-2-Clause"
     },
@@ -9759,7 +9759,7 @@
       "version": "5.6.3",
       "resolved": "https://registry.npmjs.org/typescript/-/typescript-5.6.3.tgz",
       "integrity": "sha512-hjcS1mhfuyi4WW8IWtjP7brDrG2cuDZukyrYrSauoXGNgx0S7zceP07adYkJycEr56BOUTNPzbInooiN3fn1qw==",
-      "dev": true,
+      "devOptional": true,
       "license": "Apache-2.0",
       "bin": {
         "tsc": "bin/tsc",

BIN
public/大气通量.jpg


BIN
src/assets/bg/background.jpg


+ 20 - 1
src/components/layout/AppLayout.vue

@@ -110,6 +110,25 @@ const bgRouteMap: Record<string, string> = {
   //添加地表径流相关页面的背景图
   "/samplingDesc4": "surface-runoff.jpg",
   "/surfaceRunoffInputFlux": "surface-runoff.jpg",
+  "/totalInputFlux": "background.jpg",
+  "/totalOutputFlux": "background.jpg",
+  "/netFlux": "background.jpg",
+  "/currentYearConcentration": "background.jpg",
+  "/TotalCadmiumPrediction": "background.jpg",
+  "/EffectiveCadmiumPrediction": "background.jpg",
+  "/CropCadmiumPrediction": "background.jpg",
+  "/cropRiskAssessment": "background.jpg",
+  "/farmlandQualityAssessment": "background.jpg",
+  "/Calculation": "background.jpg",
+  "/SoilAcidReductionIterativeEvolution": "background.jpg",
+  "/AcidNeutralizationModel": "background.jpg",
+  "/SoilAcidificationIterativeEvolution": "background.jpg",
+  "/TraditionalFarmingRisk": "background.jpg",
+  "/HeavyMetalCadmiumControl": "background.jpg",
+  "/SoilAcidificationControl": "background.jpg",
+  "/DetectionStatistics": "background.jpg",
+  "/FarmlandPollutionStatistics": "background.jpg",
+  "/PlantingRiskStatistics": "background.jpg",
 };
 
 // 当前是否为特殊背景图页面
@@ -120,7 +139,7 @@ function getBgImageUrl(): string {
   console.log("根据路径查找背景文件名:", bgFile);
   if (bgFile) {
     try {
-      const url = `url(${new URL(`../../assets/bg/${bgFile}`, import.meta.url).href})`;
+      const url = `url(${new URL(`../../assets/bg/background.jpg`, import.meta.url).href})`;
       return url;
     } catch (error) {
       console.error("加载背景图失败:", error);

+ 88 - 11
src/views/User/HmOutFlux/atmosDeposition/airInputFlux.vue

@@ -1,23 +1,100 @@
 <template>
-  <div class="">
-    
+  <div class="atmosphere-flux-container">
+    <div class="map-title">大气通量分布图</div>
+    <div class="map-image-container">
+      <img 
+        src="/大气通量.jpg" 
+        alt="大气通量分布图" 
+        class="map-image"
+      >
+    </div>
   </div>
 </template>
 
 <script>
 export default {
-  name: '',
-  data() {
-    return {
-      
-    };
-  },
-  methods: {
-    
-  }
+  name: 'AtmosphereFluxMap',
 };
 </script>
 
 <style scoped>
+.atmosphere-flux-container {
+  width: 100%;
+  max-width: 900px;
+  margin: 0 auto;
+  background: white;
+  border-radius: 12px;
+  box-shadow: 0 8px 30px rgba(0, 0, 0, 0.15);
+  overflow: hidden;
+  font-family: 'Segoe UI', 'Microsoft YaHei', sans-serif;
+}
+
+.map-title {
+  background: linear-gradient(to right, #1a5fad, #2c8fd1);
+  color: white;
+  text-align: center;
+  padding: 18px 0;
+  font-size: 1.8rem;
+  font-weight: 600;
+  letter-spacing: 1px;
+  text-shadow: 0 2px 4px rgba(0, 0, 0, 0.3);
+}
+
+.map-image-container {
+  padding: 25px;
+  background: #f8fafc;
+  display: flex;
+  justify-content: center;
+  align-items: center;
+  min-height: 500px;
+}
+
+.map-image {
+  max-width: 100%;
+  max-height: 100%;
+  object-fit: contain;
+  border: 1px solid #e0e7ff;
+  border-radius: 8px;
+  box-shadow: 0 5px 20px rgba(0, 0, 0, 0.1);
+  transition: transform 0.3s ease;
+}
+
+.map-image:hover {
+  transform: scale(1.02);
+}
+
+.map-footer {
+  background: #f1f5f9;
+  padding: 15px 0;
+  text-align: center;
+  font-size: 0.95rem;
+  color: #4b5563;
+  border-top: 1px solid #e5e7eb;
+}
 
+@media (max-width: 768px) {
+  .map-title {
+    font-size: 1.5rem;
+    padding: 15px 0;
+  }
+  
+  .map-image-container {
+    padding: 15px;
+    min-height: 350px;
+  }
+  
+  .map-footer {
+    font-size: 0.85rem;
+  }
+}
+
+@media (max-width: 480px) {
+  .map-title {
+    font-size: 1.3rem;
+  }
+  
+  .map-image-container {
+    min-height: 280px;
+  }
+}
 </style>

+ 26 - 9
src/views/User/HmOutFlux/irrigationWater/irriWaterInputFlux.vue

@@ -1,7 +1,7 @@
 <template>
-  <div class="irrigation-management">
+   <div class="irrigation-management" style="display: flex; justify-content: center;">
     <!-- 计算页面 -->
-    <div v-if="showCalculation">
+    <div v-if="showCalculation" class="page-container">
       <el-card shadow="always" class="gradient-card">
         <el-radio-group v-model="selectedLandType" style="width: 100%;">
           <!-- 水地 -->
@@ -99,7 +99,7 @@
     </div>
 
     <!-- 结果页面 -->
-    <div v-if="showResults">
+    <div v-if="showResults" class="page-container">
       <el-card shadow="always" class="results-card">
         <div class="results-header">
           <el-button 
@@ -113,16 +113,11 @@
         
         <div class="results-container">
           <el-row :gutter="20" style="margin-top: 30px;">
-            <el-col :span="12">
+            <el-col :span="24">
               <div class="result-subtitle">Cd含量地图</div>
               <img v-if="mapImageUrl" :src="mapImageUrl" alt="Cd含量地图" class="result-image">
               <div v-else class="image-placeholder">地图加载中...</div>
             </el-col>
-            <el-col :span="12">
-              <div class="result-subtitle">Cd含量直方图</div>
-              <img v-if="histogramImageUrl" :src="histogramImageUrl" alt="Cd含量直方图" class="result-image">
-              <div v-else class="image-placeholder">直方图加载中...</div>
-            </el-col>
           </el-row>
           
           <el-row style="margin-top: 30px;">
@@ -736,4 +731,26 @@ export default {
 .back-button:hover {
   background: linear-gradient(to right, #7de8df, #20a03d);
 }
+.irrigation-management {
+  width: 100%;
+}
+
+.page-container {
+  width: 100%;
+  display: flex;
+  justify-content: center;
+  max-width: 1200px;
+}
+
+/* 调整卡片宽度 */
+.gradient-card {
+  width: 90% !important;
+  max-width: 800px;
+}
+
+.results-card {
+  width: 95% !important;
+  max-width: 1200px;
+}
+
 </style>

+ 5 - 5
src/views/User/cadmiumPrediction/CropCadmiumPrediction.vue

@@ -201,7 +201,7 @@ export default {
     async fetchLatestMap() {
       try {
         const response = await axios.get(
-          `https://soilgd.com:8000/api/cd-prediction/crop-cd/latest-map/${this.countyName}`,
+          `http://localhost:8000/api/cd-prediction/crop-cd/latest-map/${this.countyName}`,
           { responseType: 'blob' }
         );
         
@@ -217,7 +217,7 @@ export default {
     async fetchLatestHistogram() {
       try {
         const response = await axios.get(
-          `https://soilgd.com:8000/api/cd-prediction/crop-cd/latest-histogram/${this.countyName}`,
+          `http://localhost:8000/api/cd-prediction/crop-cd/latest-histogram/${this.countyName}`,
           { responseType: 'blob' }
         );
         
@@ -396,7 +396,7 @@ export default {
         this.loadingStats = true;
         
         const response = await axios.get(
-          `https://soilgd.com:8000/api/cd-prediction/crop-cd/statistics/${this.countyName}`
+          `http://localhost:8000/api/cd-prediction/crop-cd/statistics/${this.countyName}`
         );
         
         if (response.data.success && response.data.data) {
@@ -440,7 +440,7 @@ export default {
         
         // 调用作物Cd地图接口
         const mapResponse = await axios.post(
-          'https://soilgd.com:8000/api/cd-prediction/crop-cd/generate-and-get-map',
+          'http://localhost:8000/api/cd-prediction/crop-cd/generate-and-get-map',
           formData,
           {
             headers: {
@@ -517,7 +517,7 @@ export default {
         this.$message.info('正在获取作物Cd预测数据...');
         
         const response = await axios.get(
-          `https://soilgd.com:8000/api/cd-prediction/download-final-crop-cd-csv`,
+          `http://localhost:8000/api/cd-prediction/download-final-crop-cd-csv`,
           { responseType: 'blob' }
         );
         

+ 19 - 19
src/views/User/cadmiumPrediction/EffectiveCadmiumPrediction.vue

@@ -84,17 +84,17 @@
         
         <div v-if="!loadingStats && statisticsData.length" class="stats-container">
           <!-- 统计表格 -->
-           <el-table 
-              :data="statisticsData" 
-              style="width: 100%; margin-bottom: 20px;"
-              border
-              stripe
-            >
-              <el-table-column prop="name" label="统计项" min-width="180" />
-              <el-table-column prop="value" label="值" min-width="150" />
-              <el-table-column prop="unit" label="单位" min-width="100" />
-              <el-table-column prop="description" label="描述" min-width="200" />
-            </el-table>
+         <el-table 
+            :data="statisticsData" 
+            style="width: 100%; margin-bottom: 20px;"
+            border
+            stripe
+          >
+            <el-table-column prop="name" label="统计项" min-width="180" />
+            <el-table-column prop="value" label="值" min-width="150" />
+            <el-table-column prop="unit" label="单位" min-width="100" />
+            <el-table-column prop="description" label="描述" min-width="200" />
+          </el-table>
           
           <!-- 统计图表 -->
           <div class="charts-container">
@@ -201,7 +201,7 @@ export default {
     async fetchLatestMap() {
       try {
         const response = await axios.get(
-          `https://soilgd.com:8000/api/cd-prediction/effective-cd/latest-map/${this.countyName}`,
+          `http://localhost:8000/api/cd-prediction/effective-cd/latest-map/${this.countyName}`,
           { responseType: 'blob' }
         );
         
@@ -217,7 +217,7 @@ export default {
     async fetchLatestHistogram() {
       try {
         const response = await axios.get(
-          `https://soilgd.com:8000/api/cd-prediction/effective-cd/latest-histogram/${this.countyName}`,
+          `http://localhost:8000/api/cd-prediction/effective-cd/latest-histogram/${this.countyName}`,
           { responseType: 'blob' }
         );
         
@@ -352,7 +352,7 @@ export default {
         },
         yAxis: {
           type: 'value',
-          name: 'Cd含量'
+          name: '(Cd含量)'
         },
         series: [{
           name: '统计值',
@@ -396,7 +396,7 @@ export default {
         this.loadingStats = true;
         
         const response = await axios.get(
-          `https://soilgd.com:8000/api/cd-prediction/effective-cd/statistics/${this.countyName}`
+          `http://localhost:8000/api/cd-prediction/effective-cd/statistics/${this.countyName}`
         );
         
         if (response.data.success && response.data.data) {
@@ -438,9 +438,9 @@ export default {
         formData.append('county_name', this.countyName);
         formData.append('data_file', this.selectedFile);
         
-        // 调用有效Cd地图接口
+        // 调用有效Cd地图接口
         const mapResponse = await axios.post(
-          'https://soilgd.com:8000/api/cd-prediction/effective-cd/generate-and-get-map',
+          'http://localhost:8000/api/cd-prediction/effective-cd/generate-and-get-map',
           formData,
           {
             headers: {
@@ -511,13 +511,13 @@ export default {
       URL.revokeObjectURL(link.href);
     },
     
-    // 导出数据
+    // 导出数据 - 修改为获取有效Cd的CSV文件
     async exportData() {
       try {
         this.$message.info('正在获取有效Cd预测数据...');
         
         const response = await axios.get(
-          `https://soilgd.com:8000/api/cd-prediction/download-final-effective-cd-csv`,
+          `http://localhost:8000/api/cd-prediction/download-final-effective-cd-csv`,
           { responseType: 'blob' }
         );
         

+ 499 - 99
src/views/User/cadmiumPrediction/totalInputFlux.vue

@@ -1,134 +1,534 @@
 <template>
-  <div class="cd-input-container">
-    <el-card class="gradient-card" shadow="hover">
-      <el-row :gutter="20">
-        <el-col :span="12">
-          <p class="label">大气沉降输入 Cd (g/ha/a)</p>
-          <el-input
-            v-model="atmosphericCd"
-            placeholder="请输入内容"
-            class="custom-input"
-          />
-        </el-col>
-        <el-col :span="12">
-          <p class="label">灌溉水输入 Cd (g/ha/a)</p>
-          <el-input
-            v-model="irrigationCd"
-            placeholder="请输入内容"
-            class="custom-input"
-          />
-        </el-col>
-        <el-col :span="24" style="margin-top: 20px;">
-          <p class="label">农业投入输入 Cd (g/ha/a)</p>
-          <el-input
-            v-model="agriculturalCd"
-            placeholder="请输入内容"
-            class="custom-input"
-          />
-        </el-col>
-        <el-col :span="24" style="margin-top: 20px;">
-          <el-button class="calculate-btn" @click="onCalculate">计算</el-button>
-        </el-col>
-      </el-row>
-    </el-card>
+  <div class="container">
+    <!-- 顶部操作栏 -->
+    <div class="toolbar">
+      <!-- 文件上传区域 -->
+      <div class="upload-section">
+        <input type="file" ref="fileInput" accept=".csv" @change="handleFileUpload" style="display: none">
+        <el-button class="custom-button" @click="triggerFileUpload">
+          <el-icon class="upload-icon"><Upload /></el-icon>
+          选择CSV文件
+        </el-button>
+        <span v-if="selectedFile" class="file-name">{{ selectedFile.name }}</span>
+        <el-button 
+          class="custom-button" 
+          :loading="isCalculating" 
+          :disabled="!selectedFile" 
+          @click="calculate"
+        >
+        <el-icon class="upload-icon"><Document /></el-icon>  
+        上传并计算
+        </el-button>
+      </div>
+      <!-- 操作按钮 -->
+      <div class="action-buttons">
+        <el-button class="custom-button" :disabled="!mapBlob" @click="exportMap">
+          <el-icon class="upload-icon"><Download /></el-icon>
+          导出地图</el-button>
+        <el-button class="custom-button" :disabled="!histogramBlob" @click="exportHistogram">
+          <el-icon class="upload-icon"><Download /></el-icon>
+          导出直方图</el-button>
+        <el-button class="custom-button" :disabled="!statisticsData.length" @click="exportData">
+          <el-icon class="upload-icon"><Download /></el-icon>
+          导出数据</el-button>
+      </div>
+    </div>
+
+    <!-- 主体内容区 -->
+    <div class="content-area">
+      <!-- 地图区域 - 修改为横向布局 -->
+      <div class="horizontal-container">
+        <!-- 地图展示 -->
+        <div class="map-section">
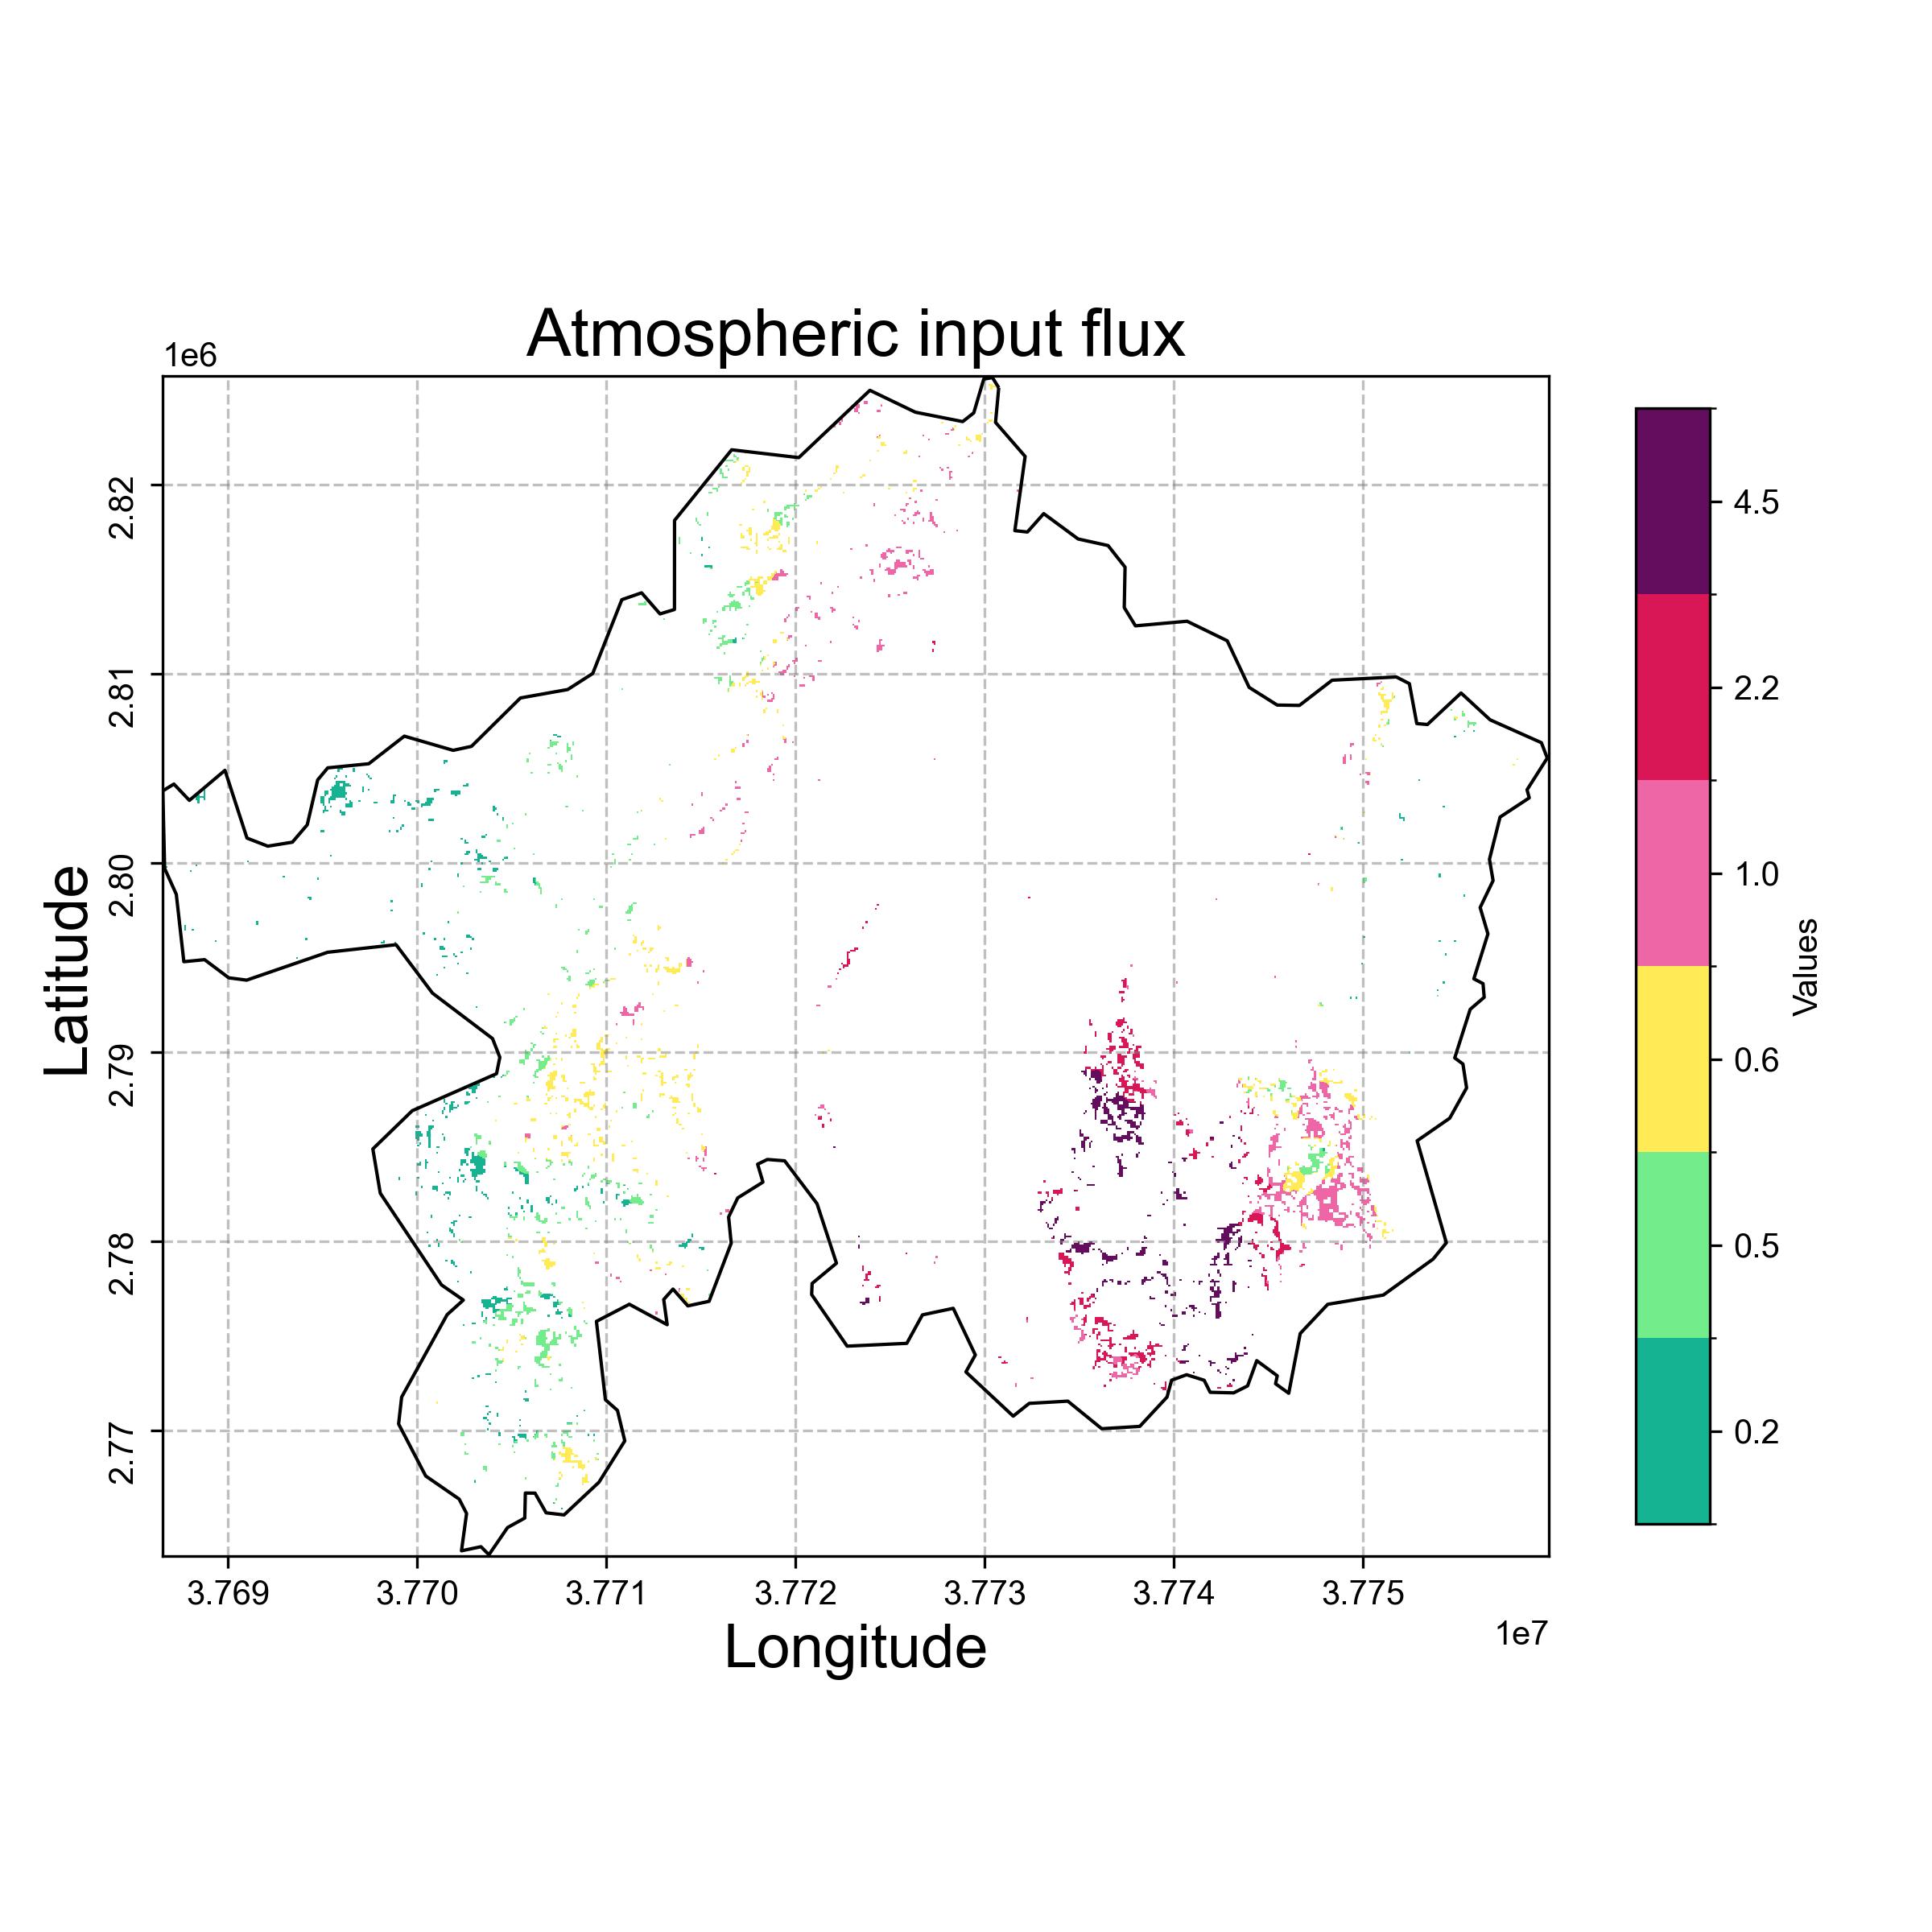
+          <h3>Cd输入通量空间分布图</h3>
+          <div v-if="loadingMap" class="loading-container">
+            <el-icon class="loading-icon"><Loading /></el-icon>
+            <span>地图加载中...</span>
+          </div>
+          <img v-if="mapImageUrl && !loadingMap" :src="mapImageUrl" alt="Cd输入通量空间分布图" class="map-image">
+          <div v-if="!mapImageUrl && !loadingMap" class="no-data">
+            <el-icon><Picture /></el-icon>
+            <p>暂无地图数据</p>
+          </div>
+        </div>
+        
+        <!-- 直方图展示 -->
+        <div class="histogram-section">
+          <h3>Cd输入通量直方图</h3>
+          <div v-if="loadingHistogram" class="loading-container">
+            <el-icon class="loading-icon"><Loading /></el-icon>
+            <span>直方图加载中...</span>
+          </div>
+          <img v-if="histogramImageUrl && !loadingHistogram" :src="histogramImageUrl" alt="Cd输入通量直方图" class="histogram-image">
+          <div v-if="!histogramImageUrl && !loadingHistogram" class="no-data">
+            <el-icon><Histogram /></el-icon>
+            <p>暂无直方图数据</p>
+          </div>
+        </div>
+      </div>
+
+      <!-- 统计图表区域 -->
+      <div class="stats-area">
+        <h3>Cd输入通量统计信息</h3>
+        <div class="model-info">
+          <el-tag type="info">Cd通量模型</el-tag>
+          <span class="update-time">
+            最后更新: {{ updateTime ? new Date(updateTime).toLocaleString() : '未知' }}
+          </span>
+        </div>
+        
+        <div v-if="loadingStats" class="loading-container">
+          <el-icon class="loading-icon"><Loading /></el-icon>
+          <span>统计数据加载中...</span>
+        </div>
+        
+        <div v-if="!loadingStats && statisticsData.length" class="stats-container">
+          <!-- 统计表格 -->
+         <el-table 
+            :data="statisticsData" 
+            style="width: 100%; margin-bottom: 20px;"
+            border
+            stripe
+          >
+            <el-table-column prop="name" label="统计项" min-width="180" />
+            <el-table-column prop="value" label="值" min-width="150" />
+            <el-table-column prop="unit" label="单位" min-width="100" />
+            <el-table-column prop="description" label="描述" min-width="200" />
+          </el-table>
+          
+        
+        <div v-if="!loadingStats && !statisticsData.length" class="no-data">
+          <el-icon><DataAnalysis /></el-icon>
+          <p>暂无统计数据</p>
+        </div>
+        </div>
+      </div>
+    </div>
   </div>
 </template>
 
-<script setup>
-import { ref } from 'vue';
-import { ElCard, ElRow, ElCol, ElInput, ElButton } from 'element-plus';
+<script>
+import * as XLSX from 'xlsx';
+import { saveAs } from 'file-saver';
+import axios from 'axios';
+import * as echarts from 'echarts';
+import { 
+  Loading, Upload, Picture, Histogram, Download, Document, DataAnalysis 
+} from '@element-plus/icons-vue';
+
+export default {
+  name: 'CdFluxVisualization',
+  components: { 
+    Loading, Upload, Picture, Histogram, Download, Document, DataAnalysis 
+  },
+  data() {
+    return {
+      isCalculating: false,
+      loadingMap: false,
+      loadingHistogram: false,
+      loadingStats: false,
+      statisticsData: [],
+      mapImageUrl: null,
+      histogramImageUrl: null,
+      mapBlob: null,
+      histogramBlob: null,
+      selectedFile: null,
+      distributionChart: null,
+      updateTime: null
+    };
+  },
+
+  mounted() {
+    // 组件挂载时获取最新数据
+    this.fetchLatestResults();
+    this.fetchStatistics();
+  },
 
-const atmosphericCd = ref('');
-const irrigationCd = ref('');
-const agriculturalCd = ref('');
+  beforeDestroy() {
+    if (this.mapImageUrl) URL.revokeObjectURL(this.mapImageUrl);
+    if (this.histogramImageUrl) URL.revokeObjectURL(this.histogramImageUrl);
+    if (this.distributionChart) this.distributionChart.dispose();
+  },
+  methods: {
+    // 触发文件选择
+    triggerFileUpload() {
+      this.$refs.fileInput.click();
+    },
+    
+    // 处理文件上传
+    handleFileUpload(event) {
+      const files = event.target.files;
+      if (files && files.length > 0) {
+        this.selectedFile = files[0];
+      } else {
+        this.selectedFile = null;
+      }
+    },
+    
+    // 获取最新结果
+    async fetchLatestResults() {
+      try {
+        this.loadingMap = true;
+        this.loadingHistogram = true;
+        
+        // 获取最新地图
+        await this.fetchLatestMap();
+        
+        // 获取最新直方图
+        await this.fetchLatestHistogram();
+        
+      } catch (error) {
+        console.error('获取最新结果失败:', error);
+        this.$message.error('获取最新结果失败');
+      } finally {
+        this.loadingMap = false;
+        this.loadingHistogram = false;
+      }
+    },
+    
+    // 获取最新地图
+    async fetchLatestMap() {
+      try {
+        const response = await axios.get(
+          `http://localhost:8000/api/cd-flux/map`,
+          { responseType: 'blob' }
+        );
+        
+        this.mapBlob = response.data;
+        this.mapImageUrl = URL.createObjectURL(this.mapBlob);
+      } catch (error) {
+        console.error('获取最新地图失败:', error);
+        this.$message.warning('获取最新地图失败,请先执行预测');
+      }
+    },
+    
+    // 获取最新直方图
+    async fetchLatestHistogram() {
+      try {
+        const response = await axios.get(
+          `http://localhost:8000/api/cd-flux/histogram`,
+          { responseType: 'blob' }
+        );
+        
+        this.histogramBlob = response.data;
+        this.histogramImageUrl = URL.createObjectURL(this.histogramBlob);
+      } catch (error) {
+        console.error('获取最新直方图失败:', error);
+        this.$message.warning('获取最新直方图失败,请先执行预测');
+      }
+    },
+    
+    // 格式化统计数据
+    formatStatisticsData(stats) {
+      if (!stats) return [];
+      
+      return [
+        { name: '最小值', value: stats.min.toFixed(4), unit: 'g/ha/year', description: '样本中的最小Cd通量' },
+        { name: '最大值', value: stats.max.toFixed(4), unit: 'g/ha/year', description: '样本中的最大Cd通量' },
+        { name: '平均值', value: stats.mean.toFixed(4), unit: 'g/ha/year', description: '所有样本的平均Cd通量' },
+        { name: '标准差', value: stats.std.toFixed(4), unit: 'g/ha/year', description: 'Cd通量的标准差' },
+        { name: '有效像元数', value: stats.valid_pixels, unit: '个', description: '有效数据点的数量' },
+        { name: '总像元数', value: stats.total_pixels, unit: '个', description: '总像元数量' }
+      ];
+    },
 
-const onCalculate = () => {
-  // 暂无计算逻辑,仅作展示
-  alert('计算按钮已点击');
+    // 修改fetchStatistics方法
+    async fetchStatistics() {
+      try {
+        this.loadingStats = true;
+        
+        const response = await axios.get(
+          `http://localhost:8000/api/cd-flux/statistics`
+        );
+        
+        if (response.data) {
+          const stats = response.data;
+          this.statisticsData = this.formatStatisticsData(stats);
+          this.updateTime = new Date().toISOString();
+          
+          this.$nextTick(() => {
+            this.initCharts(stats);
+          });
+        }
+      } catch (error) {
+        console.error('获取统计信息失败:', error);
+        this.$message.warning('获取统计信息失败');
+      } finally {
+        this.loadingStats = false;
+      }
+    },
+    
+    // 处理窗口大小变化
+    handleResize() {
+      if (this.distributionChart) this.distributionChart.resize();
+    },
+    
+    // 上传并计算
+    async calculate() {
+      if (!this.selectedFile) {
+        this.$message.warning('请先选择CSV文件');
+        return;
+      }
+      
+      try {
+        this.isCalculating = true;
+        this.loadingMap = true;
+        this.loadingHistogram = true;
+        this.loadingStats = true;
+        
+        // 创建FormData
+        const formData = new FormData();
+        formData.append('csv_file', this.selectedFile);
+        
+        // 调用Cd通量计算接口
+        await axios.post(
+          'http://localhost:8000/api/cd-flux/calculate',
+          formData,
+          {
+            headers: {
+              'Content-Type': 'multipart/form-data'
+            }
+          }
+        );
+        
+        // 更新后重新获取地图、直方图和统计数据
+        await this.fetchLatestResults();
+        await this.fetchStatistics();
+        
+        this.$message.success('计算完成!');
+        
+      } catch (error) {
+        console.error('计算失败:', error);
+        let errorMessage = '计算失败,请重试';
+        
+        if (error.response) {
+          if (error.response.status === 400) {
+            errorMessage = '文件格式错误:' + (error.response.data.detail || '请上传正确的CSV文件');
+          } else if (error.response.status === 500) {
+            errorMessage = '服务器错误:' + (error.response.data.detail || '请稍后重试');
+          }
+        }
+        
+        this.$message.error(errorMessage);
+      } finally {
+        this.isCalculating = false;
+        this.loadingMap = false;
+        this.loadingHistogram = false;
+        this.loadingStats = false;
+      }
+    },
+    
+    // 导出地图
+    exportMap() {
+      if (!this.mapBlob) {
+        this.$message.warning('请先计算生成地图');
+        return;
+      }
+      
+      const link = document.createElement('a');
+      link.href = URL.createObjectURL(this.mapBlob);
+      link.download = `Cd输入通量空间分布图.jpg`;
+      link.click();
+      URL.revokeObjectURL(link.href);
+    },
+    
+    // 导出直方图
+    exportHistogram() {
+      if (!this.histogramBlob) {
+        this.$message.warning('请先计算生成直方图');
+        return;
+      }
+      
+      const link = document.createElement('a');
+      link.href = URL.createObjectURL(this.histogramBlob);
+      link.download = `Cd输入通量直方图.jpg`;
+      link.click();
+      URL.revokeObjectURL(link.href);
+    },
+    
+    // 导出数据
+    async exportData() {
+      try {
+        this.$message.info('正在获取Cd输入通量数据...');
+        
+        const response = await axios.get(
+          `http://localhost:8000/api/cd-flux/export-csv`,
+          { responseType: 'blob' }
+        );
+        
+        const blob = new Blob([response.data], { type: 'text/csv' });
+        const link = document.createElement('a');
+        link.href = URL.createObjectURL(blob);
+        link.download = `Cd输入通量数据.csv`;
+        link.click();
+        URL.revokeObjectURL(link.href);
+        
+        this.$message.success('数据导出成功');
+      } catch (error) {
+        console.error('导出数据失败:', error);
+        this.$message.error('导出数据失败: ' + (error.response?.data?.detail || '请稍后重试'));
+      }
+    }
+  }
 };
 </script>
 
 <style scoped>
-.cd-input-container {
-  display: flex;
-  justify-content: center;
-  align-items: center;
+/* 保持原有样式不变 */
+.container {
   padding: 20px;
-}
-
-.gradient-card {
-  /* 半透明渐变背景 */
+  /* 添加70%透明度的渐变背景 */
   background: linear-gradient(
     135deg, 
-    rgba(250, 253, 255, 0.8), 
-    rgba(137, 223, 252, 0.8)
+    rgba(230, 247, 255, 0.7) 0%, 
+    rgba(240, 248, 255, 0.7) 100%
   );
-  border-radius: 12px;
-  box-shadow: 0 8px 24px rgba(0, 0, 0, 0.1);
-  padding: 30px;
-  text-align: left; /* 改为左对齐 */
-  width: 600px;
+  min-height: 100vh;
+  box-sizing: border-box;
+}
+
+.toolbar {
+  display: flex;
+  flex-direction: column;
+  gap: 15px;
+  margin-bottom: 20px;
+  padding: 15px;
+  background-color: rgba(255, 255, 255, 0.8); /* 调整为半透明白色 */
+  border-radius: 8px;
+  box-shadow: 0 2px 12px rgba(0, 0, 0, 0.1);
   backdrop-filter: blur(5px); /* 添加模糊效果增强半透明感 */
-  border: none;
 }
 
-.label {
+.upload-section {
+  display: flex;
+  align-items: center;
+  gap: 15px;
+  padding-bottom: 15px;
+  border-bottom: 1px solid rgba(0, 0, 0, 0.1); /* 调整边框透明度 */
+}
+
+.file-name {
+  flex: 1;
+  padding: 0 10px;
+  color: #666;
+  font-size: 14px;
+  overflow: hidden;
+  text-overflow: ellipsis;
+  white-space: nowrap;
+}
+
+.action-buttons {
+  display: flex;
+  gap: 10px;
+}
+
+.custom-button {
+  background-color: #47C3B9 !important;
+  color: #DCFFFA !important;
+  border: none;
+  border-radius: 155px;
+  padding: 10px 20px;
   font-weight: bold;
-  font-size: 18px;
-  margin-bottom: 10px; /* 减少底部外边距 */
-  color: #333;
+  display: flex;
+  align-items: center;
+}
+
+.upload-icon {
+  margin-right: 5px;
 }
 
-.custom-input {
+.content-area {
+  display: flex;
+  flex-direction: column;
+  gap: 20px;
+}
+
+/* 横向布局容器 */
+.horizontal-container {
+  display: flex;
+  flex-wrap: wrap;
+  gap: 20px;
   width: 100%;
-  max-width: 200px;
-  margin-left: 0; /* 确保输入框靠左对齐 */
 }
 
-/* 自定义输入框样式 */
-:deep(.custom-input .el-input__inner) {
-  background: rgba(255, 255, 255, 0.7);
+.map-section, .histogram-section {
+  flex: 1;
+  min-width: 300px;
+  background-color: rgba(255, 255, 255, 0.8); /* 调整为半透明白色 */
   border-radius: 8px;
-  border: 1px solid #dcdfe6;
-  box-shadow: 0 2px 6px rgba(0, 0, 0, 0.05);
-  padding: 10px 15px;
-  font-size: 16px;
-  color: #333;
+  padding: 15px;
+  box-shadow: 0 2px 12px rgba(0, 0, 0, 0.1);
+  position: relative;
+  min-height: 400px;
+  backdrop-filter: blur(5px); /* 添加模糊效果增强半透明感 */
 }
 
-:deep(.custom-input .el-input__inner:focus) {
-  border-color: #409EFF;
-  box-shadow: 0 0 0 2px rgba(64, 158, 255, 0.2);
+.map-image, .histogram-image {
+  width: 100%;
+  height: 100%;
+  max-height: 600px;
+  object-fit: contain;
+  border-radius: 4px;
 }
 
-.calculate-btn {
+.table-area {
   width: 100%;
-  max-width: 200px;
-  height: 50px;
-  border: none;
-  border-radius: 25px !important;
-  font-size: 18px;
-  font-weight: bold;
-  transition: all 0.4s ease;
-  
-  /* 渐变背景色 */
-  background: linear-gradient(to right, #8DF9F0, #26B046);
-  color: white !important;
-  /* 按钮整体阴影 */
-  box-shadow: 0 4px 10px rgba(0, 0, 0, 0.15),
-              0 2px 6px rgba(38, 176, 70, 0.3) inset;
+  background-color: rgba(255, 255, 255, 0.8); /* 调整为半透明白色 */
+  border-radius: 8px;
+  padding: 15px;
+  box-shadow: 0 2px 12px rgba(0, 0, 0, 0.1);
+  margin-top: 20px;
+  backdrop-filter: blur(5px); /* 添加模糊效果增强半透明感 */
+}
+
+.loading-container {
+  display: flex;
+  flex-direction: column;
+  align-items: center;
+  justify-content: center;
+  height: 300px;
+  color: #47C3B9;
+}
+
+.no-data {
+  display: flex;
+  flex-direction: column;
+  align-items: center;
+  justify-content: center;
+  height: 300px;
+  color: #999;
+  font-size: 16px;
+}
+
+.no-data .el-icon {
+  font-size: 48px;
+  margin-bottom: 10px;
 }
 
-.calculate-btn:hover {
-  transform: scale(1.03);
-  box-shadow: 0 6px 12px rgba(0, 0, 0, 0.2),
-              0 2px 8px rgba(38, 176, 70, 0.4) inset;
-  background: linear-gradient(to right, #7de8df, #20a03d);
+.loading-icon {
+  font-size: 36px;
+  margin-bottom: 10px;
+  animation: rotate 2s linear infinite;
 }
 
-.calculate-btn:active {
-  transform: scale(0.98);
-  box-shadow: 0 2px 8px rgba(0, 0, 0, 0.1),
-              0 1px 6px rgba(38, 176, 70, 0.4) inset;
+@keyframes rotate {
+  from {
+    transform: rotate(0deg);
+  }
+  to {
+    transform: rotate(360deg);
+  }
+}
+
+/* 响应式布局调整 */
+@media (max-width: 992px) {
+  .horizontal-container {
+    flex-direction: column;
+  }
+  
+  .map-section, .histogram-section {
+    width: 100%;
+    flex: none;
+  }
 }
 </style>

+ 461 - 125
src/views/User/farmlandQualityAssessment/farmlandQualityAssessment.vue

@@ -1,187 +1,523 @@
 <template>
   <div>
-    <!-- 三个按钮 -->
-    <div class="button-container">
-      <!-- 优先保护类按钮 -->
-      <el-button class="custom-button priority" @click="handleClick('优先保护类', '#4E94F4')">优先保护类</el-button>
-      <!-- 安全利用类按钮 -->
-      <el-button class="custom-button safe" @click="handleClick('安全利用类', '#26BB91')">安全利用类</el-button>
-      <!-- 严格管控类按钮 -->
-      <el-button class="custom-button strict" @click="handleClick('严格管控类', '#77B369')">严格管控类</el-button>
-    </div>
-
-    <!-- 文字和图表区域,只有选中按钮后才显示 -->
-    <div v-show="selectedText" class="info-section">
-      <!-- 显示选中的类别文字 -->
-      <div class="selected-text" :style="{ color: selectedColor }">{{ selectedText }}</div>
-
-      <!-- 图表区域 -->
-      <div class="charts">
-        <!-- 柱状图容器 -->
-        <div ref="barChart" class="chart"></div>
-        <!-- 饼图容器 -->
-        <div ref="pieChart" class="chart"></div>
+    <!-- 顶部信息卡片区域 -->
+    <div class="dashboard">
+      <!-- 合并的统计与分布卡片 -->
+      <div class="dashboard-card combined-card">
+        <div class="card-title">统计与分布</div>
+        <div class="combined-content">
+          <!-- 左侧:单元统计 -->
+          <div class="statistics-section">
+            <h3>单元统计</h3>
+            <div class="statistics">
+              <div class="stat-item">
+                <div class="stat-value">{{ statistics.total_units }}</div>
+                <div class="stat-label">总单元数</div>
+              </div>
+              <div class="stat-item">
+                <div class="stat-value">{{ statistics.units_with_data }}</div>
+                <div class="stat-label">有数据单元</div>
+              </div>
+              <!-- 仅当无数据单元数不为0时显示 -->
+              <div class="stat-item" v-if="statistics.units_without_data !== 0">
+                <div class="stat-value">{{ statistics.units_without_data }}</div>
+                <div class="stat-label">无数据单元</div>
+              </div>
+            </div>
+          </div>
+          
+          <!-- 右侧:分类分布 -->
+          <div class="distribution-section">
+            <h3>分类分布</h3>
+            <div class="distribution">
+              <div v-for="(count, category) in statistics.category_distribution" :key="category" 
+                  class="category-dist" :style="{ backgroundColor: categoryColors[category] }">
+                <div class="dist-category">{{ category }}</div>
+                <div class="dist-count">{{ count }}</div>
+              </div>
+            </div>
+          </div>
+        </div>
+      </div>
+      
+      <!-- 饼图卡片 -->
+      <div class="dashboard-card chart-card">
+        <div class="card-title">点位分类分布</div>
+        <div ref="pointPieChart" class="chart"></div>
       </div>
     </div>
+    
+    <!-- 地图区域 -->
+    <div class="map-area">
+      <div class="map-title">土壤分类分布地图</div>
+      <div ref="mapContainer" class="map-container"></div>
+    </div>
   </div>
 </template>
 
 <script>
-import * as echarts from 'echarts'; // 引入echarts库
+import * as echarts from 'echarts';
+
+// 分类颜色配置
+const categoryColors = {
+  '优先保护类': 'rgba(255, 214, 0, 0.7)', // #FFD600 转换为RGBA
+  '安全利用类': 'rgba(0, 200, 83, 0.7)', // #00C853 转换为RGBA
+  '严格管控类': 'rgba(213, 0, 0, 0.7)'   // #D50000 转换为RGBA
+};
 
 export default {
-  name: 'CategoryButtons',
+  name: 'CategoryMap',
   data() {
     return {
-      selectedText: '',        // 当前选中的类别文字
-      selectedColor: '',       // 当前选中的类别颜色
-      barChartInstance: null,  // 柱状图实例
-      pieChartInstance: null   // 饼图实例
+      map: null,
+      geoJSONLayer: null,
+      multiPolygon: null, 
+      categoryColors,
+      statistics: {
+        total_units: 0,
+        units_with_data: 0,
+        units_without_data: 0,
+        category_distribution: {
+          '优先保护类': 0,
+          '安全利用类': 0,
+          '严格管控类': 0
+        },
+        point_distribution: {
+          '优先保护类': 0,
+          '安全利用类': 0,
+          '严格管控类': 0
+        }
+      },
+      groupingData: [] // 存储接口数据
     };
   },
-  mounted() {
-  // 默认选中“优先保护类”
-  this.handleClick('优先保护类', '#4E94F4');
-},
+  async mounted() {
+    // 获取分类数据
+    await this.fetchGroupingData();
+    
+    // 初始化地图
+    await this.initMap();
+    
+    // 初始化点位分布饼图
+    this.initPointPieChart();
+  },
   methods: {
-    // 按钮点击事件,设置类别和颜色,并生成随机数据
-    handleClick(category, color) {
-      this.selectedText = category;
-      this.selectedColor = color;
-
-      // 模拟柱状图数据
-      const barData = [
-        { name: 'A', value: Math.floor(Math.random() * 100) },
-        { name: 'B', value: Math.floor(Math.random() * 100) },
-        { name: 'C', value: Math.floor(Math.random() * 100) }
-      ];
-
-      // 模拟饼图数据
-      const pieData = [
-        { name: 'X', value: Math.floor(Math.random() * 100) },
-        { name: 'Y', value: Math.floor(Math.random() * 100) },
-        { name: 'Z', value: Math.floor(Math.random() * 100) }
-      ];
-
-      // 等DOM更新后初始化图表
-      this.$nextTick(() => {
-        this.initBarChart(barData);
-        this.initPieChart(pieData);
+    // 获取分类数据
+    async fetchGroupingData() {
+      try {
+        const response = await fetch(`http://localhost:8000/api/unit-grouping/h_xtfx`);
+        const result = await response.json();
+        
+        if (result.success) {
+          this.groupingData = result.data;
+          this.statistics = result.statistics;
+        }
+      } catch (error) {
+        console.error('获取分类数据失败:', error);
+      }
+    },
+    
+    // 初始化地图
+    async initMap() {
+      // 加载TMap SDK
+      const TMap = await this.loadSDK();
+      
+      // 创建地图实例
+      this.map = new TMap.Map(this.$refs.mapContainer, {
+        center: new TMap.LatLng(24.81088, 113.59762),
+        zoom: 12,
+        mapStyleId: 'style1'
       });
+      
+      // 加载GeoJSON数据
+      const geojsonData = await this.loadGeoJSON('https://soilgd.com/data/单元格.geojson');
+      
+      // 初始化GeoJSON图层 - 传递TMap对象
+      this.initMapWithGeoJSON(geojsonData, TMap);
     },
-
-    // 初始化柱状图
-    initBarChart(data) {
-      // 如果实例不存在则初始化
-      if (!this.barChartInstance) {
-        this.barChartInstance = echarts.init(this.$refs.barChart);
-      }
-      // 柱状图配置项
-      const option = {
-        title: { text: '柱状图', left: 'center' },
-        xAxis: { type: 'category', data: data.map(d => d.name) },
-        yAxis: { type: 'value' },
-        series: [
-          {
-            data: data.map(d => d.value),
-            type: 'bar',
-            itemStyle: {
-              color: this.selectedColor // 使用选中的颜色
-            }
+    
+    // 加载SDK
+    loadSDK() {
+      return new Promise((resolve, reject) => {
+        if (window.TMap) return resolve(window.TMap);
+        
+        const script = document.createElement('script');
+        script.src = `https://map.qq.com/api/gljs?v=2.exp&libraries=basic,service,vector&key=${import.meta.env.VITE_TMAP_KEY}&callback=initTMap`;
+        
+        window.initTMap = () => {
+          if (!window.TMap) {
+            reject(new Error('TMap SDK 加载失败'));
+            return;
           }
-        ]
-      };
-      // 设置配置项
-      this.barChartInstance.setOption(option);
+          resolve(window.TMap);
+        };
+        
+        script.onerror = (err) => {
+          reject(new Error('加载地图SDK失败'));
+          document.head.removeChild(script);
+        };
+        
+        document.head.appendChild(script);
+      });
+    },
+    
+    // 加载GeoJSON数据
+    async loadGeoJSON(url) {
+      try {
+        const response = await fetch(url);
+        if (!response.ok) {
+          throw new Error(`加载GeoJSON失败: ${response.statusText}`);
+        }
+        return await response.json();
+      } catch (error) {
+        console.error('加载GeoJSON数据失败:', error);
+        return { type: 'FeatureCollection', features: [] };
+      }
     },
+    
+    // 初始化GeoJSON图层 - 使用MultiPolygon的setStyles方法
+    initMapWithGeoJSON(geojsonData, TMap) {
+      try {
+        // 创建分类映射表
+        const categoryMap = {};
+        this.groupingData.forEach(item => {
+          categoryMap[item.OBJECTID] = item.h_xtfx;
+        });
+        
+        // 处理GeoJSON特征
+        geojsonData.features.forEach(feature => {
+          const objectId = feature.properties.OBJECTID;
+          const category = categoryMap[objectId];
+          
+          // 添加分类属性
+          feature.properties.category = category;
+        });
+        
+        // 检查TMap对象是否有效
+        if (!TMap || !TMap.PolygonStyle) {
+          throw new Error('TMap对象无效,缺少PolygonStyle');
+        }
+        
+        // 创建GeoJSON图层
+        this.geoJSONLayer = new TMap.vector.GeoJSONLayer({
+          map: this.map,
+          data: geojsonData,
+          polygonStyle: new TMap.PolygonStyle({
+            color: 'rgba(0,0,0,0)',
+            showBorder: false
+          })
+        });
 
-    // 初始化饼图
-    initPieChart(data) {
-      // 如果实例不存在则初始化
-      if (!this.pieChartInstance) {
-        this.pieChartInstance = echarts.init(this.$refs.pieChart);
+        
+        // 获取多边形覆盖层
+        this.multiPolygon = this.geoJSONLayer.getGeometryOverlay('polygon');
+        this.multiPolygon.setMap(this.map);
+        const polygons = this.multiPolygon.getGeometries();
+        
+        // 创建样式映射
+        const styles = {};
+        
+        // 遍历所有多边形,为每个多边形设置样式和唯一ID
+        // 遍历所有多边形,为每个多边形设置样式
+        polygons.forEach((polygon) => {
+          // 直接访问properties属性
+          const properties = polygon.properties;
+          const category = properties.category;
+          
+          // 使用多边形的id作为样式ID的键
+          const styleId = `style_${polygon.id}`;
+          
+          // 根据分类设置颜色
+          const color = category ? this.categoryColors[category] : '#CCCCCC';
+          
+          // 添加样式到映射表
+          styles[styleId] = new TMap.PolygonStyle({
+            color: color,
+            showBorder: true,
+            borderColor: '#000000',
+            borderWidth: 2
+          });
+          
+          // 关键修复:为每个多边形设置样式ID(正确方式)
+          polygon.styleId = styleId; // 直接设置属性
+        });
+        // 使用setStyles方法一次性设置所有样式
+        this.multiPolygon.setStyles(styles);
+        
+        // 更新几何体以应用新样式
+        this.multiPolygon.updateGeometries(polygons);
+        
+      
+      } catch (error) {
+        console.error('初始化GeoJSON图层失败:', error);
       }
-      // 饼图配置项
+    },
+    
+    // 初始化点位分布饼图
+    initPointPieChart() {
+      const chartDom = this.$refs.pointPieChart;
+      if (!chartDom) return;
+      
+      const chart = echarts.init(chartDom);
+      
+      // 准备饼图数据
+      const pieData = Object.entries(this.statistics.category_distribution).map(([name, value]) => ({
+        name,
+        value,
+        itemStyle: { color: this.categoryColors[name] || '#CCCCCC' }
+      }));
+      
       const option = {
-        title: { text: '饼图', left: 'center' },
-        tooltip: { trigger: 'item' },
+        title: {
+          text: '点位分类分布',
+          left: 'center',
+          textStyle: {
+            fontSize: 18,
+            fontWeight: 'bold'
+          }
+        },
+        tooltip: {
+          trigger: 'item',
+          formatter: '{b}: {c} ({d}%)'
+        },
+        legend: {
+          orient: 'horizontal',
+          bottom: 10,
+          data: Object.keys(this.statistics.point_distribution)
+        },
         series: [
           {
+            name: '点位分布',
             type: 'pie',
-            radius: '60%',
-            data,
+            radius: ['40%', '70%'],
+            center: ['50%', '45%'],
+            avoidLabelOverlap: true,
+            itemStyle: {
+              borderRadius: 10,
+              borderColor: '#fff',
+              borderWidth: 2
+            },
+            label: {
+              show: true,
+              formatter: '{b}: {c}\n({d}%)',
+              fontSize: 14
+            },
             emphasis: {
+              label: {
+                show: true,
+                fontSize: 16,
+                fontWeight: 'bold'
+              },
               itemStyle: {
                 shadowBlur: 10,
                 shadowOffsetX: 0,
                 shadowColor: 'rgba(0, 0, 0, 0.5)'
               }
-            }
+            },
+            data: pieData
           }
         ]
       };
-      // 设置配置项
-      this.pieChartInstance.setOption(option);
+      
+      chart.setOption(option);
+      
+      // 响应式调整
+      window.addEventListener('resize', () => {
+        chart.resize();
+      });
     }
-  },
-  
+  }
 };
 </script>
 
 <style scoped>
-.button-container {
+/* 顶部信息卡片区域 */
+.dashboard {
   display: flex;
-  justify-content: space-between;
-  padding: 56px 350px 0 350px;
+  flex-wrap: wrap;
+  gap: 20px;
+  margin-bottom: 20px;
 }
 
-.custom-button {
-  width: 320px;
-  height: 120px;
-  font-size: 36px;
-  font-weight: bold;
-  color: #fff;
-  border: none;
-  border-radius: 8px;
+.dashboard-card {
+  flex: 1;
+  min-width: 280px;
+  background: white;
+  border-radius: 12px;
+  box-shadow: 0 4px 12px rgba(0, 0, 0, 0.08);
+  padding: 20px;
+  transition: transform 0.3s ease;
 }
 
-.priority {
-  background-color: #4E94F4; /* 优先保护类按钮颜色 */
+.dashboard-card:hover {
+  transform: translateY(-3px);
 }
 
-.safe {
-  background-color: #26BB91; /* 安全利用类按钮颜色 */
+.chart-card {
+  min-width: 350px;
+  display: flex;
+  flex-direction: column;
 }
 
-.strict {
-  background-color: #77B369; /* 严格管控类按钮颜色 */
+.combined-card {
+  min-width: 500px;
 }
 
-.info-section {
-  margin-top: 30px;
-  margin-left: 50px;
+.card-title {
+  font-size: 18px;
+  font-weight: 600;
+  color: #1a1a1a;
+  padding-bottom: 12px;
+  margin-bottom: 15px;
+  border-bottom: 1px solid #eee;
 }
 
-.selected-text {
-  font-size: 36px;
-  font-weight: bold;
-  margin-bottom: 20px;
+/* 合并内容样式 */
+.combined-content {
+  display: flex;
+  gap: 20px;
+}
+
+.statistics-section, .distribution-section {
+  flex: 1;
+}
+
+.statistics-section h3, .distribution-section h3 {
+  font-size: 16px;
+  font-weight: 600;
+  margin-bottom: 15px;
+  color: #409EFF;
+  text-align: center;
 }
 
-.charts {
+/* 统计信息样式 */
+.statistics {
   display: flex;
-  justify-content: center;
-  gap: 100px; /* 图表之间的间距 */
-  flex-wrap: wrap; /* 可选:小屏幕时换行显示 */
-  margin-top: 20px;
+  flex-direction: column;
+  gap: 15px;
+}
+
+.stat-item {
+  text-align: center;
+  padding: 15px;
+  background: #f8fafc;
+  border-radius: 8px;
+  box-shadow: 0 2px 6px rgba(0, 0, 0, 0.05);
+  transition: all 0.3s ease;
+}
+
+.stat-item:hover {
+  transform: translateY(-3px);
+  box-shadow: 0 4px 10px rgba(0, 0, 0, 0.1);
+}
+
+.stat-value {
+  font-size: 26px;
+  font-weight: 700;
+  color: #409EFF;
+  margin-bottom: 5px;
+}
+
+.stat-label {
+  font-size: 14px;
+  color: #666;
+}
+
+/* 分类分布样式 */
+.distribution {
+  display: flex;
+  flex-direction: column;
+  gap: 12px;
+}
+
+.category-dist {
+  padding: 15px;
+  border-radius: 8px;
+  color: white;
+  display: flex;
+  justify-content: space-between;
+  align-items: center;
+  box-shadow: 0 2px 6px rgba(0, 0, 0, 0.1);
+  transition: transform 0.2s ease;
+}
+
+.category-dist:hover {
+  transform: scale(1.02);
 }
 
+.dist-category {
+  font-size: 16px;
+  font-weight: 600;
+}
+
+.dist-count {
+  font-size: 24px;
+  font-weight: bold;
+}
+
+/* 饼图样式 */
 .chart {
-  width: 600px;
-  height: 450px;
-  background-color: #fff;
+  height: 300px;
+  width: 100%;
+  margin-top: 10px;
+}
+
+/* 地图区域样式 */
+.map-area {
+  margin-top: 20px;
+  background: white;
   border-radius: 12px;
-  box-shadow: 0 4px 12px rgba(0, 0, 0, 0.1);
+  box-shadow: 0 4px 12px rgba(0, 0, 0, 0.08);
+  overflow: hidden;
+}
+
+.map-title {
+  font-size: 18px;
+  font-weight: 600;
+  padding: 15px 25px;
+  background-color: #f8fafc;
+  border-bottom: 1px solid #eee;
 }
 
+.map-container {
+  width: 100%;
+  height: 60vh; /* 调整为60vh,更紧凑 */
+  min-height: 400px; /* 降低最小高度 */
+  max-height: 700px; /* 添加最大高度限制 */
+}
+
+/* 响应式调整 */
+@media (max-width: 992px) {
+  .dashboard {
+    flex-direction: column;
+  }
+  
+  .dashboard-card {
+    width: 100%;
+  }
+  
+  .combined-content {
+    flex-direction: column;
+  }
+  
+  .combined-card, .chart-card {
+    min-width: 100%;
+  }
+  
+  /* 移动设备上地图高度调整 */
+  .map-container {
+    height: 55vh;
+    min-height: 350px;
+    max-height: 600px;
+  }
+}
+
+/* 小屏幕设备进一步调整 */
+@media (max-width: 768px) {
+  .map-container {
+    height: 50vh;
+    min-height: 300px;
+    max-height: 500px;
+  }
+}
 </style>